
Transparency & Trust: Explore the ClimateForce Impact Dashboard
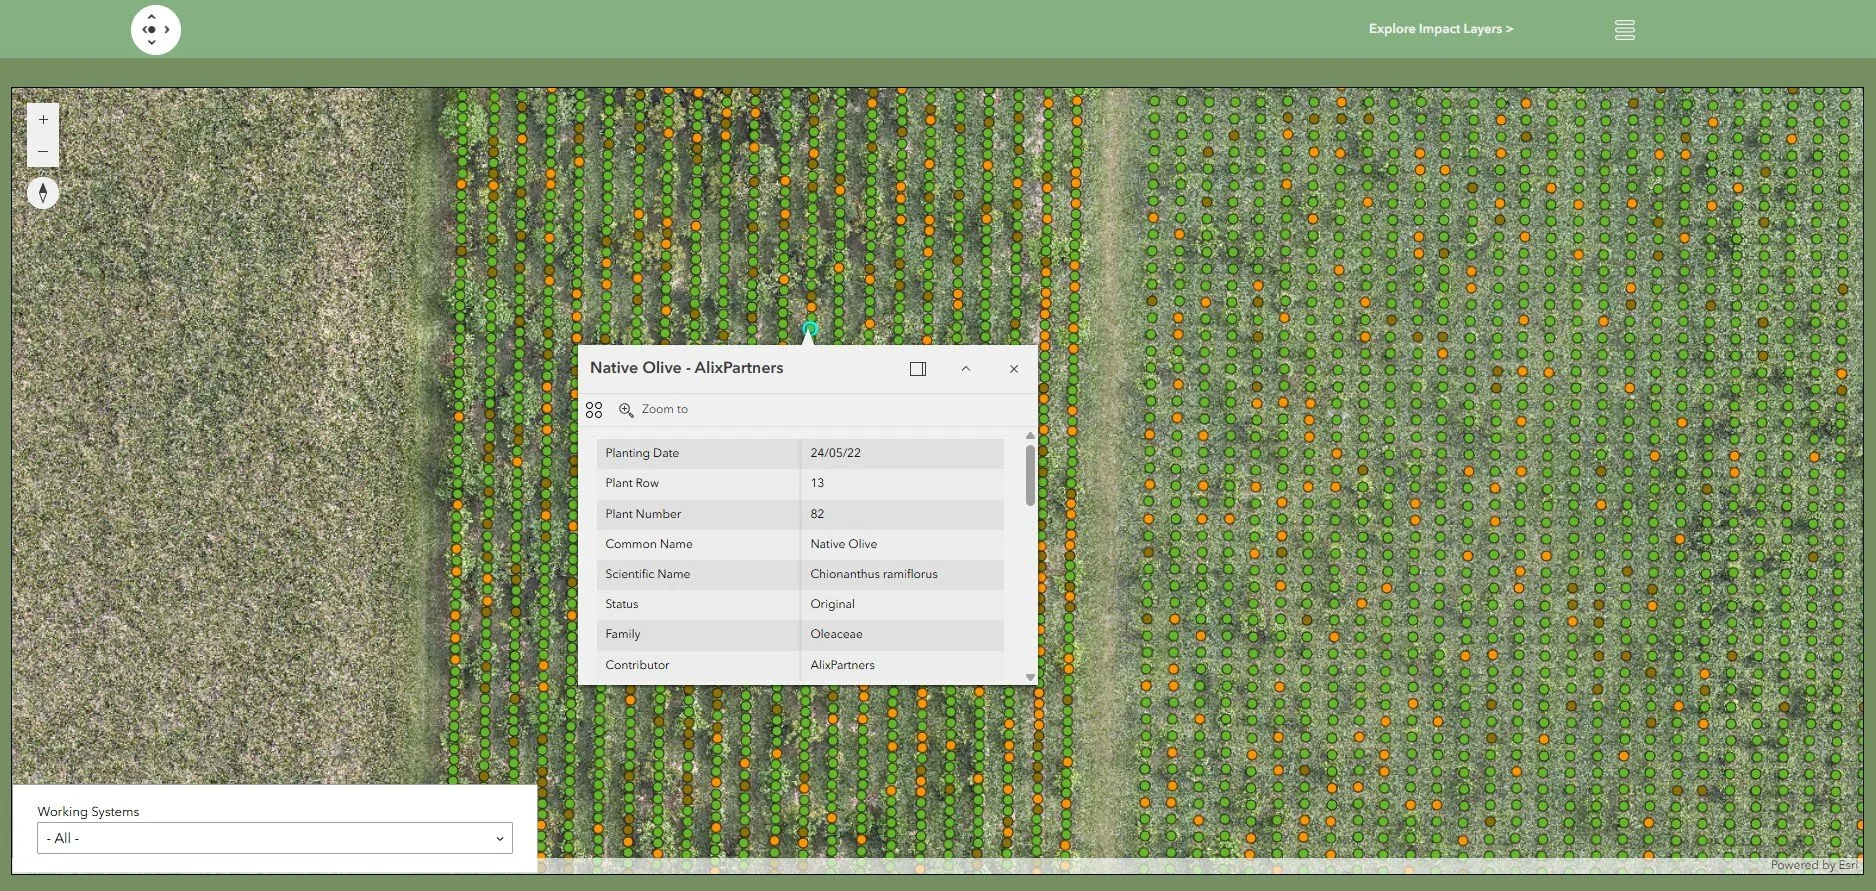
There is real value in seeing progress for yourself, beyond a report or a social media caption, in the gradual restoration of a living place, tree by tree and system by system.
That is why we built the ClimateForce Impact Dashboard. It is more than a set of metrics, it is an invitation to follow the work as it happens, to see what has been achieved and to track what is still unfolding.
Here is a walk through what it shows.
Working Systems: The Beating Heart of Regeneration
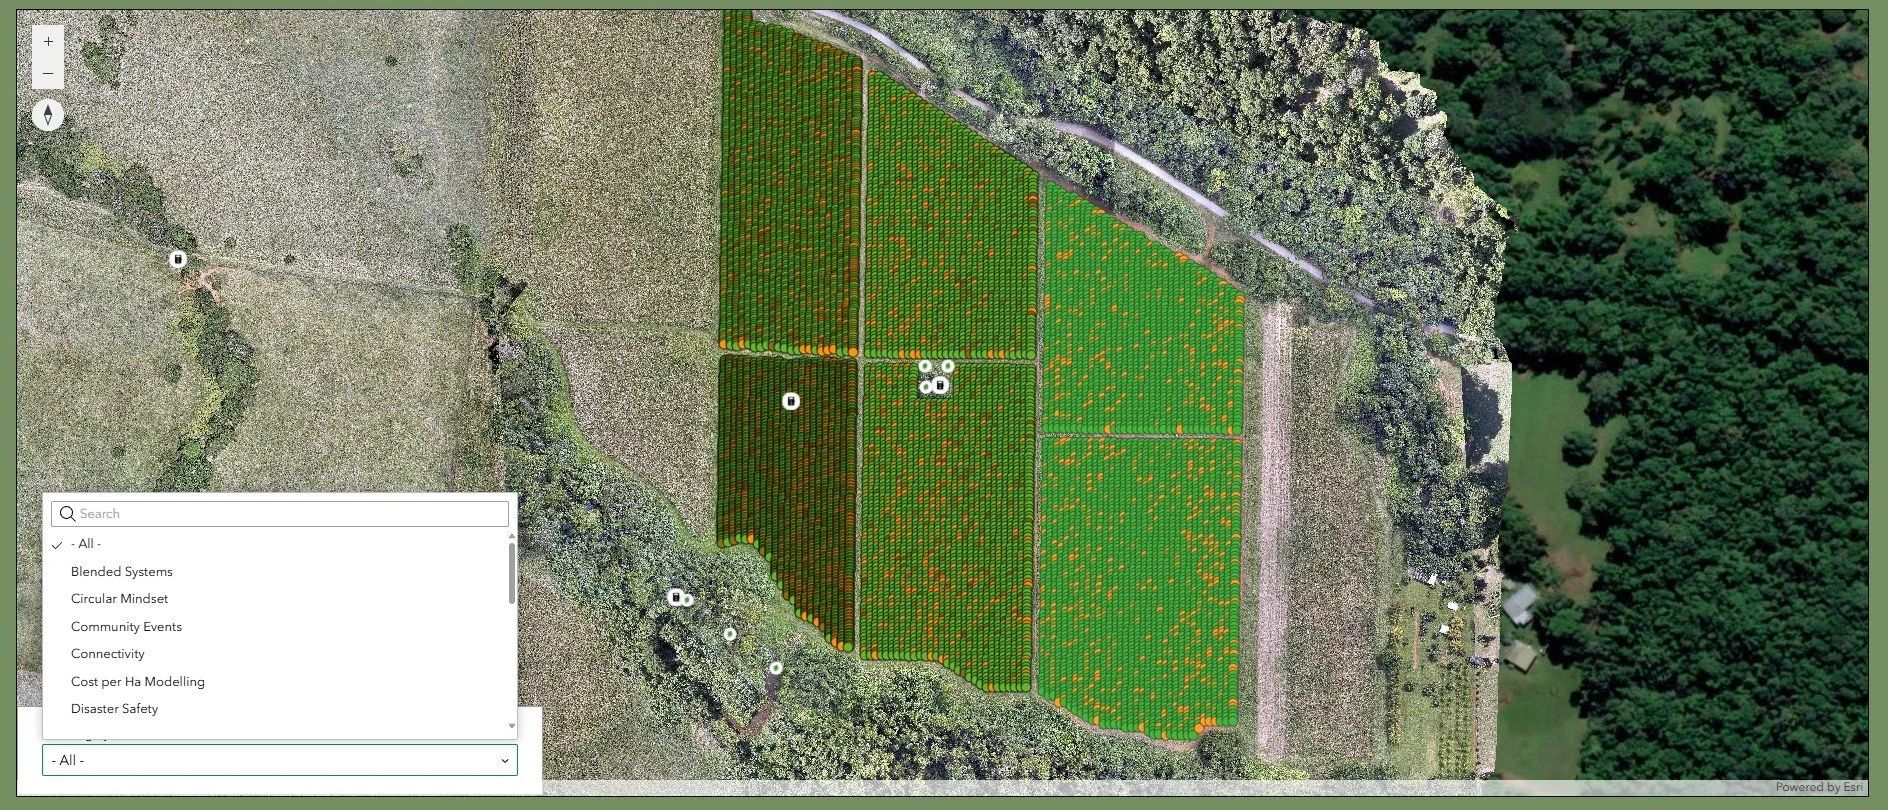
The dashboard opens on Working Systems, our digital control room.
This is a working off-grid restoration hub, and this section shows what it takes to keep it running. Solar arrays, nursery water systems, energy systems and overall systems design are all laid out here, because growing a forest from scratch involves far more than planting. It depends on a whole network of infrastructure running quietly in the background every day.
Here you can see how energy flows through the site, how seedlings are cared for, and how our systems are scaled to meet the growing demands of the land, the people working on it and the project as a whole.
Leaderboard: Your Tree. Your Name. Your Legacy.
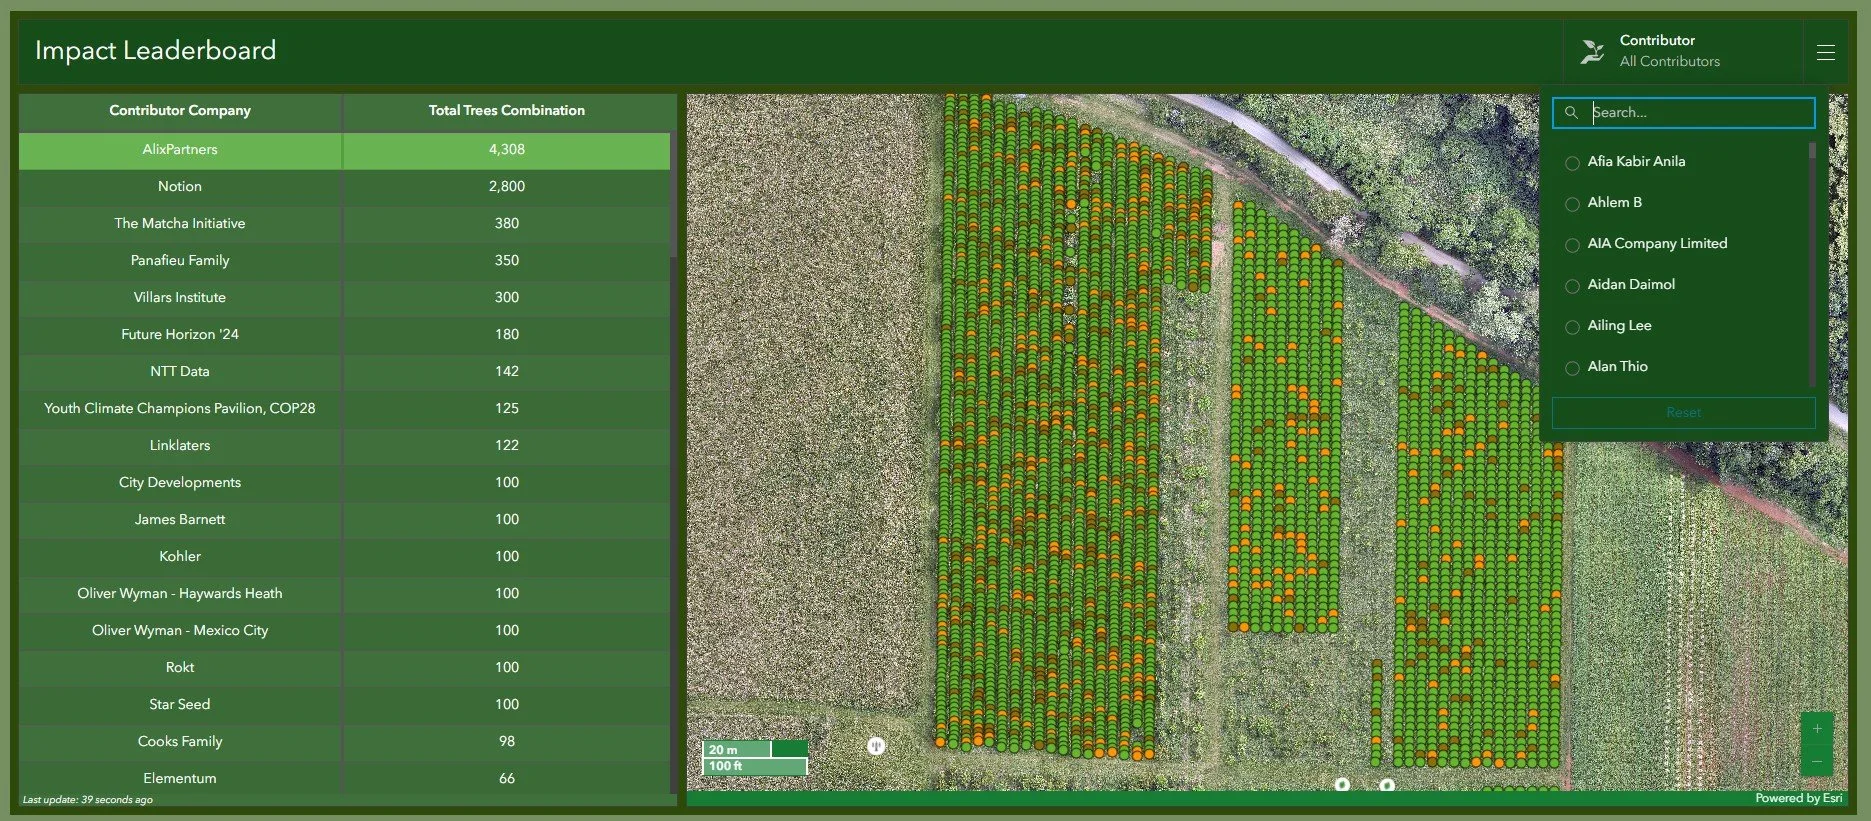
One of our favourite parts of the dashboard is the Leaderboard, a live, searchable record of everyone who has helped put roots in the ground with us.
Sponsoring a tree makes you part of a living map. You can search for your name or your organisation’s, click through and zoom in to the exact location of your tree within the planting site. You will see which species you supported, where it was planted and how it is growing as part of the wider system.
It turns a contribution into something tangible, a direct link between you and the land. The Leaderboard makes restoration personal, and we believe that is something the field needs more of: a real, visible and lasting connection between people and the places they help restore.
Species Explorer: More Than Just a Name Tag
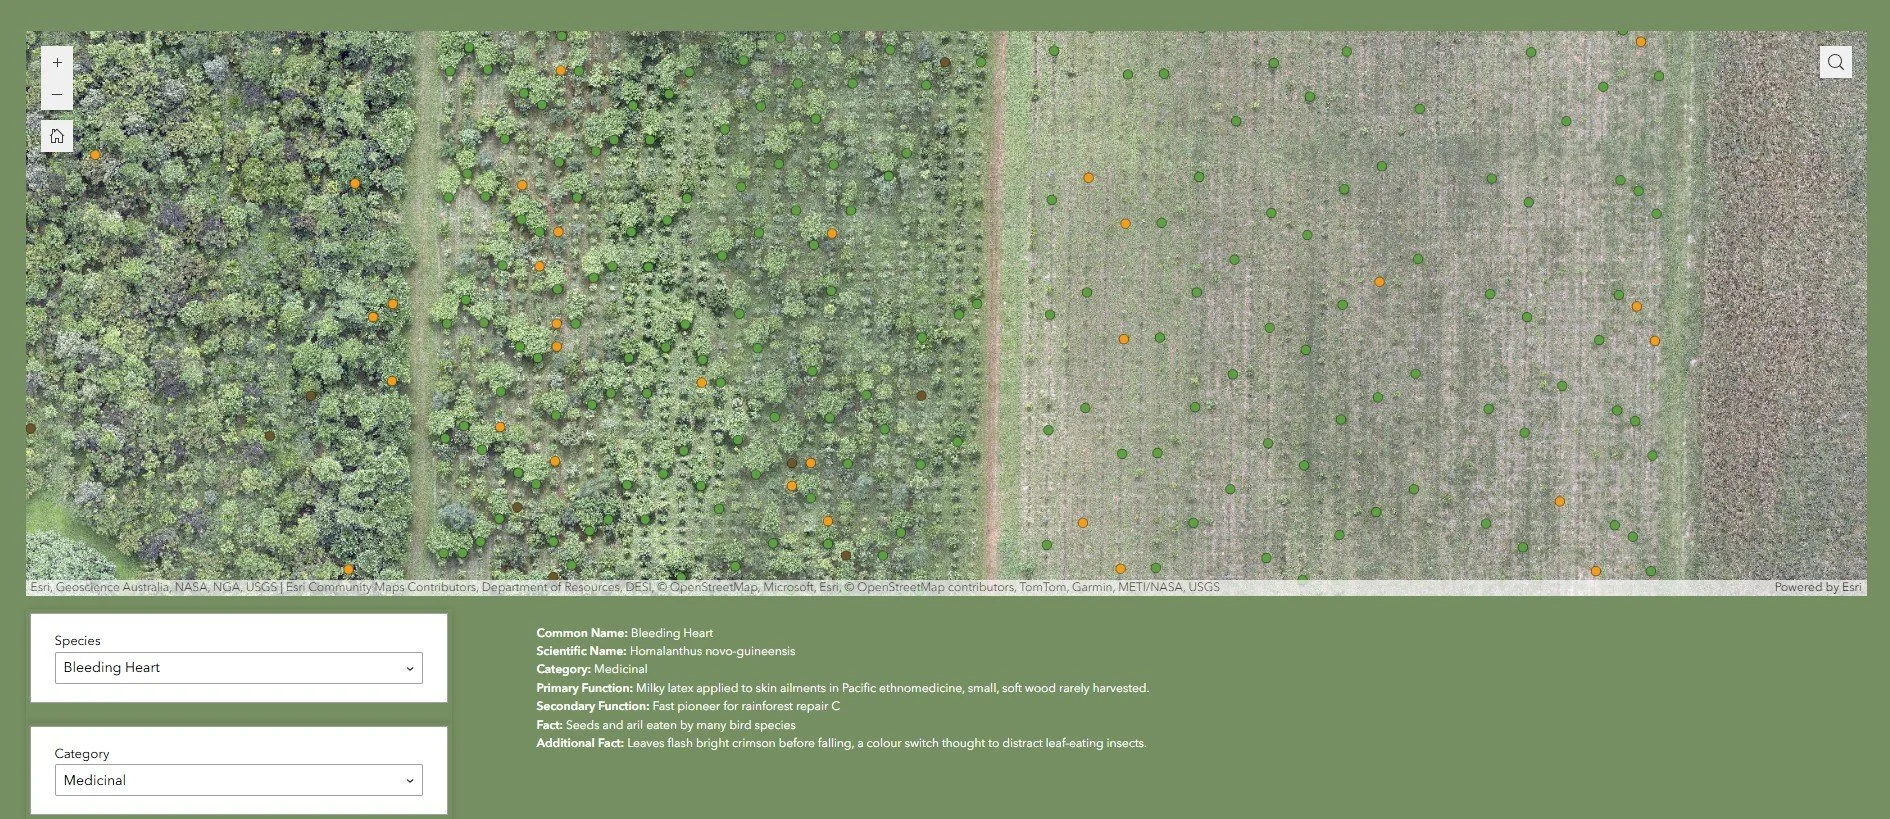
The Species tab is where the plant enthusiasts among us come into our own. It lets you explore every species we have planted across our restoration zones, from rainforest giants to lesser-known support species.
It works as a living field guide, showing how each species is distributed, the role it plays in the system and how it can be used, whether for fruit, fibre, shade, soil building or habitat.
You can trace where particular trees appear across the landscape and learn about their cultural uses, their ecological functions and the reasons they were chosen.
Restoration is never random. Every species is selected with care, and the Species tab shows how each one fits into the larger design.
Infrastructure: What It Really Takes
The Infrastructure tab shows the part of our work most people never see, which is exactly why we wanted to include it.
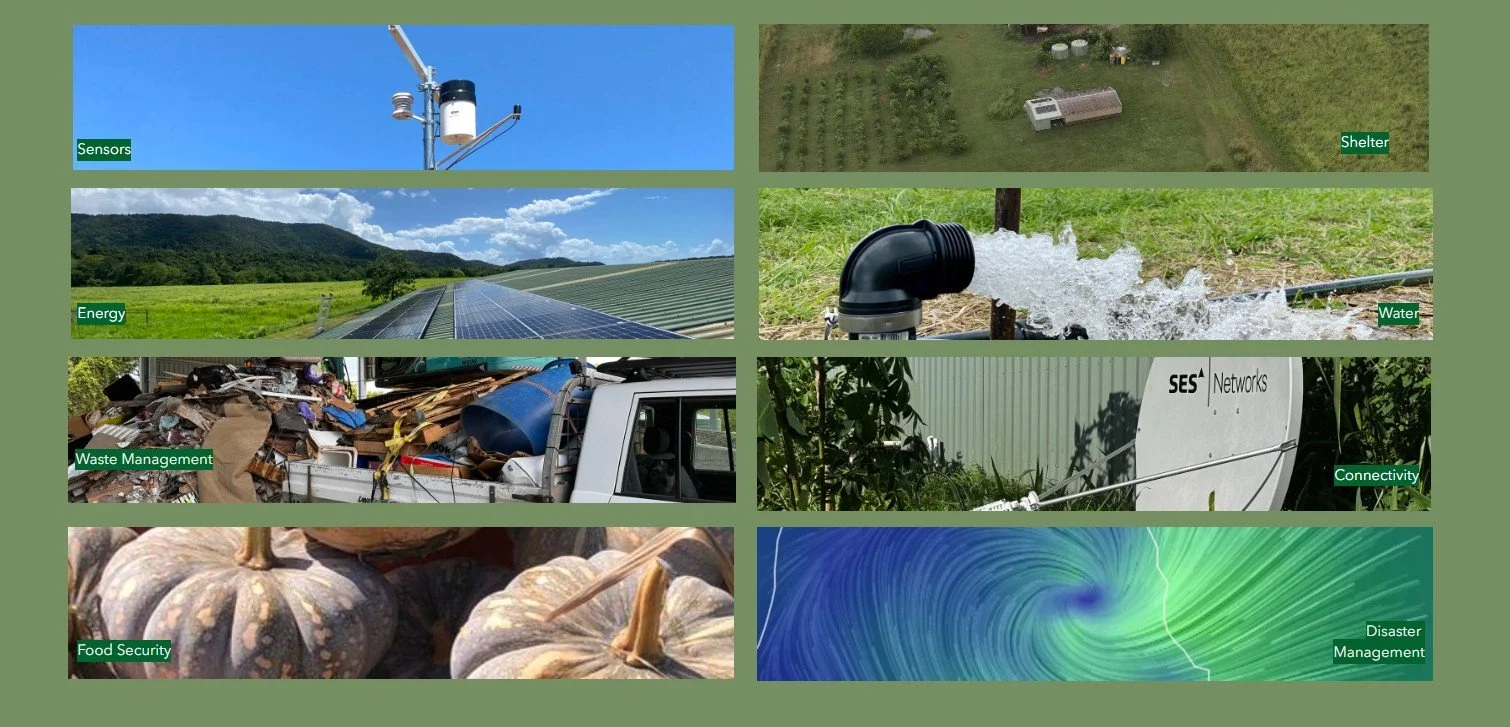
It sets out the built systems that make an off-grid regenerative operation possible: communications networks, water lines, nursery tables, field shelters, solar systems, toilets, amenities and tool sheds.
None of it is glamorous, but it is the backbone of everything we do. Growing a forest depends on systems that allow it to be planted, managed, monitored and adapted, even in remote and difficult terrain. This tab recognises that work and the quiet foundations that make all the growth above ground possible.
Culture: The Soul of the System
Regeneration is about people as much as ecology. It involves stories, memory and a sense of belonging.
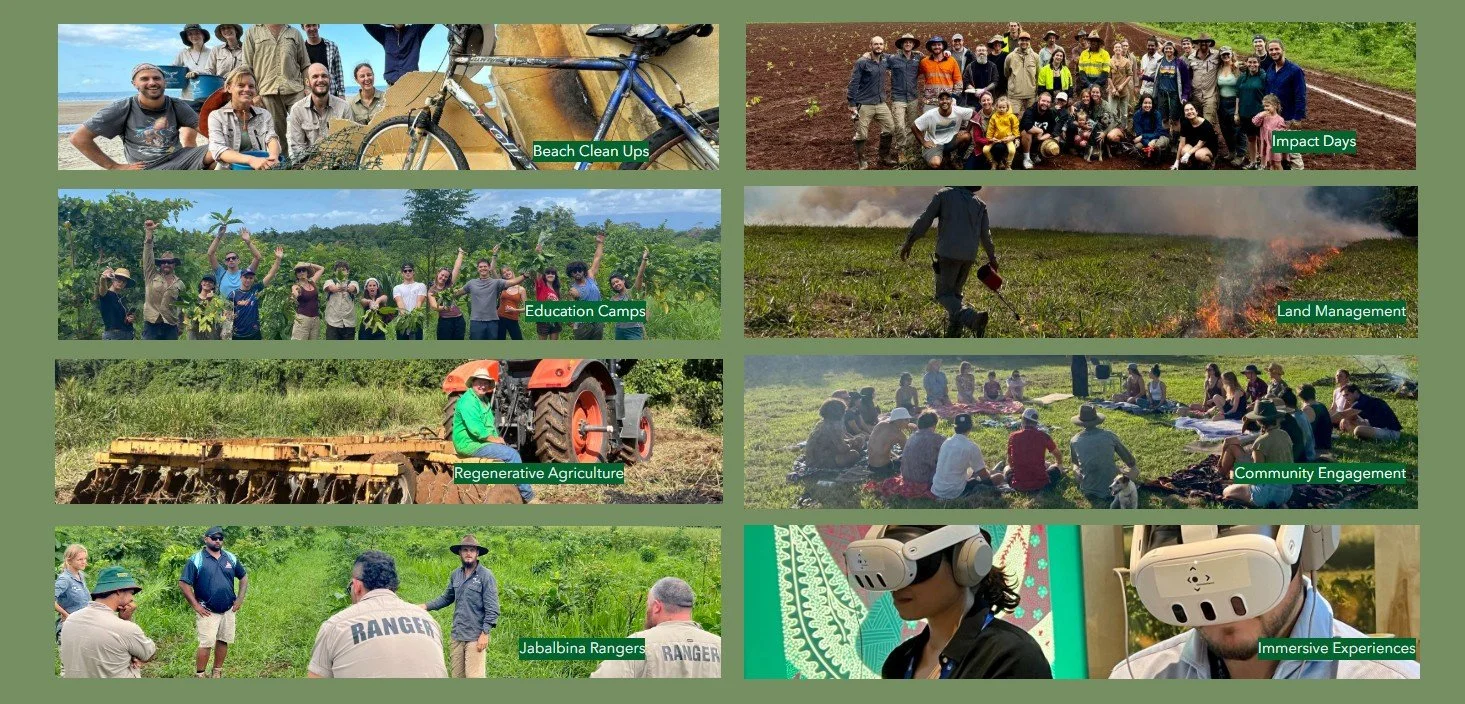
The Culture tab connects you to the deeper threads that give this work its meaning. It links to articles exploring the values, ethics and lived experience behind the project, from ceremonial planting days and youth-led programs to knowledge exchange between elders and young people and collaborative research.
This is where we write about circular thinking, cultural memory, community events, ethical supply chains and everything else that makes a restoration site feel alive beyond the trees.
A forest is shaped by the people who care for it, and a project without culture is little more than a spreadsheet.
Progress: See the Change, Swipe by Swipe
Finally, the Progress tab lets you watch the transformation take place.
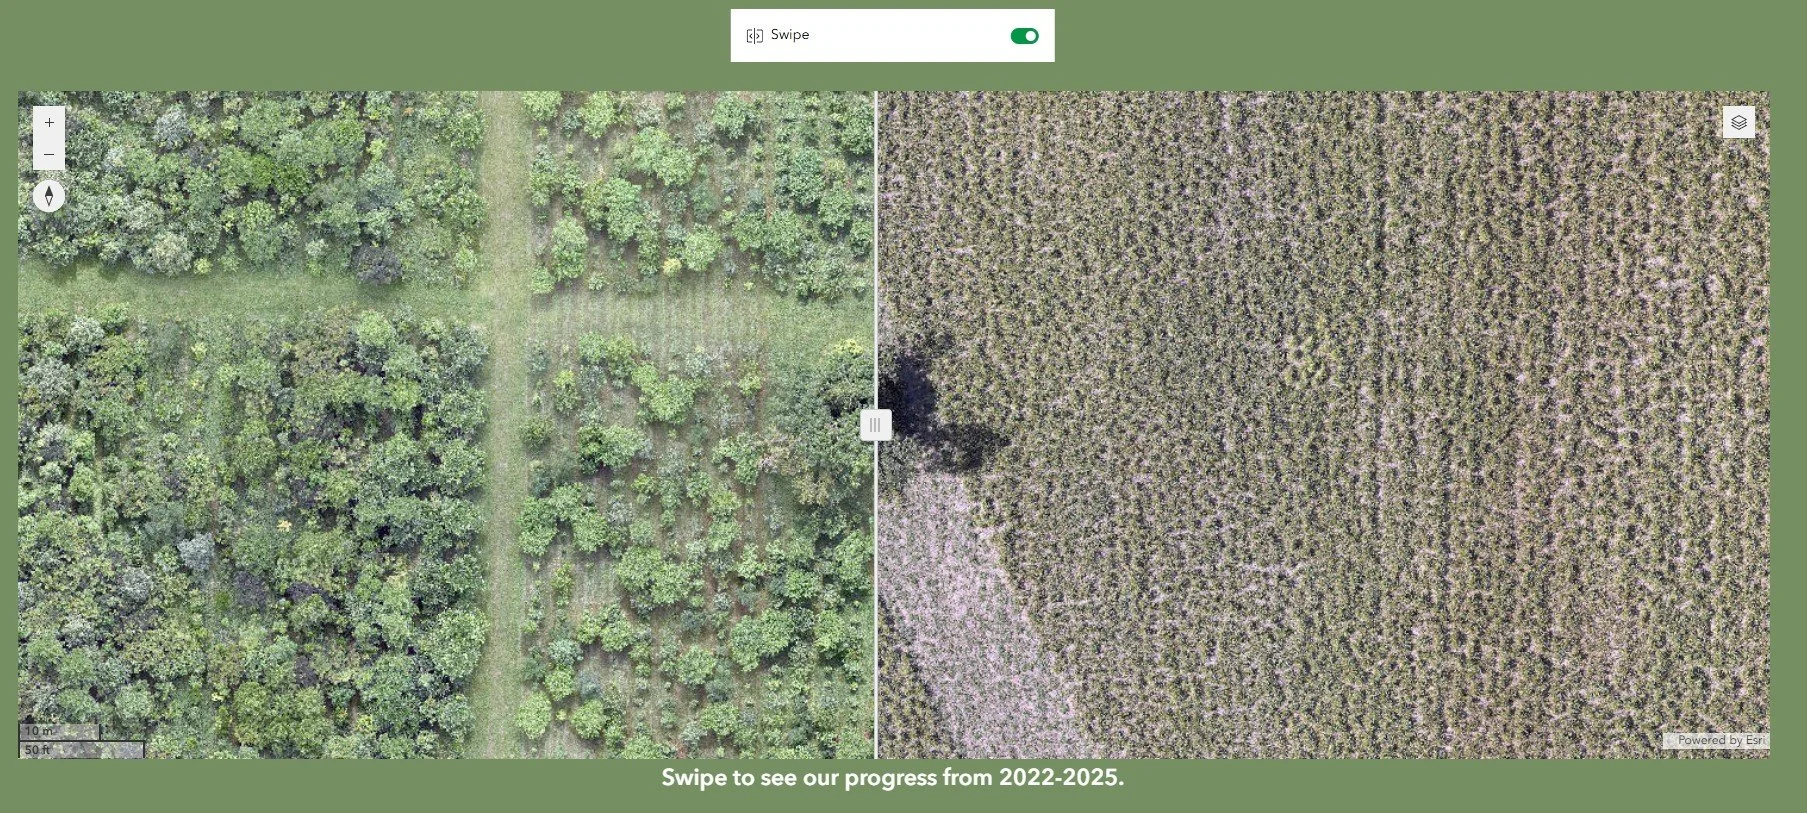
A swipe overlay allows you to compare the land as it looked before planting began with how it looks today.
Saying the forest is growing is one thing. Seeing it is another: the canopy closing in, layers of vegetation forming, and light and shade falling across what was once bare grassland.
This tab brings everything together, from the infrastructure and the trees to the species and the systems behind them. It is where the momentum of the project becomes visible, as measurable progress rather than hope alone.
Why We Built This, and Why It’s Only the Beginning
We did not build this dashboard simply to report back. We built it to invite people in: to learn, to ask questions, to celebrate, to hold us accountable, and to feel part of a living system they are helping to create.
Whether you are a donor, a researcher, a student, a funder or simply curious, the dashboard is for you. It offers a shared view of what is working, what we are learning and how the project is growing.
Click in, zoom around and explore what it takes to grow a forest from seed. And if it inspires you, there is a tree waiting to carry your name into this story.
